


Hi cf, I want to show you a small, but funny script.
It loads the submission of some codeforces user and builds a graph showing the number of 'Accepted' verdicts each month (graph's desighn is really similar to cf rating ones). I had used Flot to draw the graphs.
Examples:
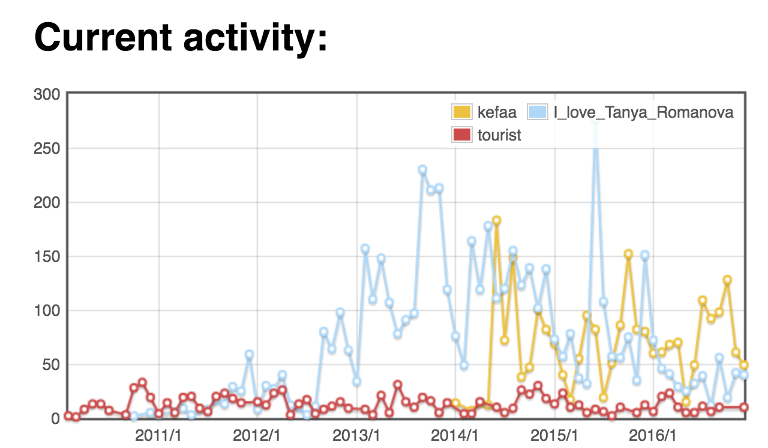
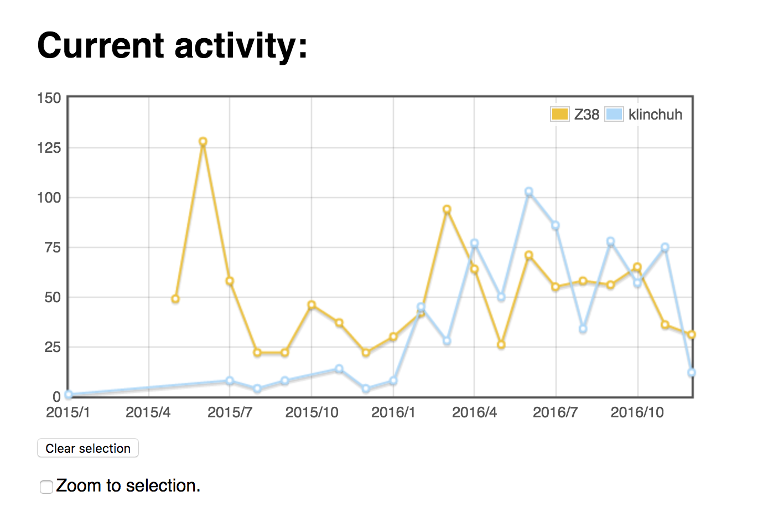
As you can see from the second screenshot, Flot can zoom the graph, you can search for only 2016 year results, for example.
How to download and install it?
Windows: The program which loads the data is build in exe, so you don't have to install python interpreter.
Download windows zip from dropbox.
Unzip, open the folder. We need just two files from a lot of shit there: main.exe (programm for adding or deleting users from graph) and Result.html (result graph, open in any browser and enjoy).
Linux/ Mac:
Download another zip from dropbox
Unzip, open the folder. To add or delete a user from graph, using python2.7 run main.py, and open Result.html in any browser to see the result graph.


Maybe you could remove the folder "__MACOSX"?
BTW, it's nice and interesting. :D
Of course I can, but does it really worries you?)
Thanks!
Nice work man
P.S. try to put the total number of solved problems next to each handle