


I made statistics of the rating and tags of problems based on their in-contest letter assignment (A, B, C, etc.) using the Codeforces API.
What I took into consideration
First of all, only problems taken from contests labeled with Div. 1 or Div. 2 were taken into consideration (I say labeled because I only checked if the division string existed in the contest name). Contests that were labeled Div. 3 or didn't have a listed division (Global Rounds, for example) were not used. Div. 1 problems are offset by the Div. 2 problems. What I mean by this is usually, the Div. 2 C is the Div. 1 A, and in these statistics, I represented them like the former so that I wouldn't get Div. 1 A ratings mixed with Div. 2 A ratings because, well, that would be bad and it was easier lol (the API did it for me). Only problems representable up to H were used, because the later ones were too scarce (and quite frankly, odd in terms of ratings).
Possible Sources of Error
Obviously, by only using Div. 1 & Div. 2 labeled contests, we lose problems from things like Global Rounds. Also, there are a lot more Div. 2 contests than Div. 1, some being independent of a Div. 1 contest instead of appearing in pairs. This means there will be much more A, B, C, and D problems than E, F, G, and H. One problem that I had to deal with was that since there were independent Div. 1 contests (Bubble Cup), they would've actually added ratings and tags to the A, B, C datasets, where Div. 2 A, B, and C statistics were supposed to go. I skipped contests that were Div. 1 and had an A, but that also reduces the amount of problems for C, D, E, F, G, and H. Additionally, the problems that appear in pairs or triplets (C1 & C2, for example) could not be counted because they do not fall under a specific category, but we lost more problems. For the tag distribution, the problems with multiple tags may over represent some categories, but I'm not too worried about that since most problems have at least 2 tags.
Total Problems Analyzed
- A — 596
- B — 583
- C — 382
- D — 386 (the low occurrences of C & D is most likely due to the pair-problem issue explained above)
- E — 391
- F — 161
- G — 67
- H — 11
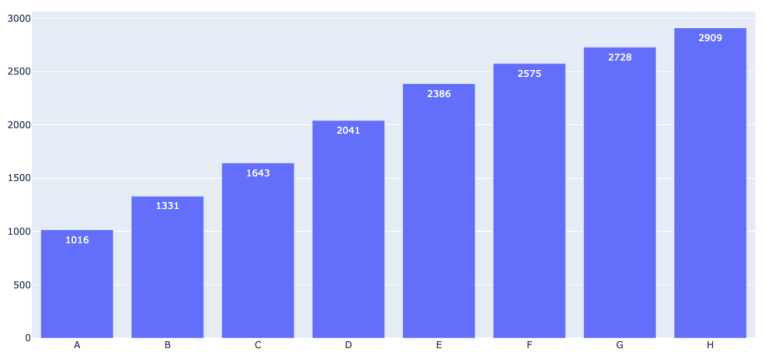
Average Problem Ratings
Highest Tags Per Problem
- A — implementation: 426, math: 176, brute force: 145
- B — implementation: 321, greedy: 180, math: 171
- C — greedy: 141, implementation: 137, math: 107
- D — dp: 130, greedy: 103, math: 99
- E — dp: 147, data structures: 122, math: 80
- F — dp: 85, data structures: 55, graphs: 38
- G — data structures: 28, dp: 20, math: 18
- H — data structures: 4, trees: 4, constructive algorithms: 3
Brief Analysis
A quick look at the chart shows that A is usually solvable for most users at an average difficulty of 1016. There appears to be around a 343 difficulty change on each problem from A through E, and then around a 174 difficulty change on each problem from E through H. A look at the tag statistics shows a surprising amount of information. For one, math remains a very important topic regardless of rank. I was slightly surprised by the fact that sortings/binary search was not on the top 3 for A, B, or C. Regardless, they are very important topics from my experience. Greedy also seems to be very important on problems B & C. There is a large shift between C & D, as DP becomes a very relevant topic past C. Although not shown, the graphs and dfs and similar tags (they really need to be combined) are very close to the top 3 tags on C, D, and E, so they are a very relevant topic even on C. Data structures makes its appearance on E, and becomes the most occurring tag on the later problems. My advice is limited so I appreciate comments on patterns that all competitors have seen.
Conclusion
I hoped you learned more information of the problems that you were interested. Although this is good information, do not let this information completely drive your training. This information is an average, not an absolute. That being said, this information can help you filter the problems you train on (there are filters on the problemset page!). And remember, statistics can help you guess what to expect, but with enough practice, you won't need to guess what to expect. This is the only real statistic that will help you learn more: 
Solve more problems. Please post important topics in your personal experience and your analysis of this information in the comments!


Auto comment: topic has been updated by TexanElite (previous revision, new revision, compare).
Thanks for the analysis! It would be nice to have a separate analysis for each div.
real data analyst