


Now (13 March 2021) there are 6786 problems on Codeforces (my code on GitHub). 142 of them have no rating. What is problem complexity distribution for 6646 problems which have rating?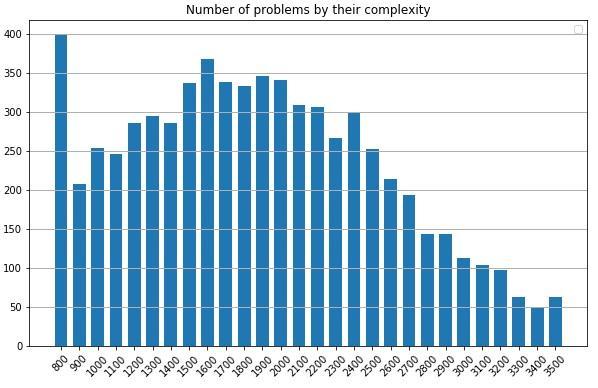 .
.
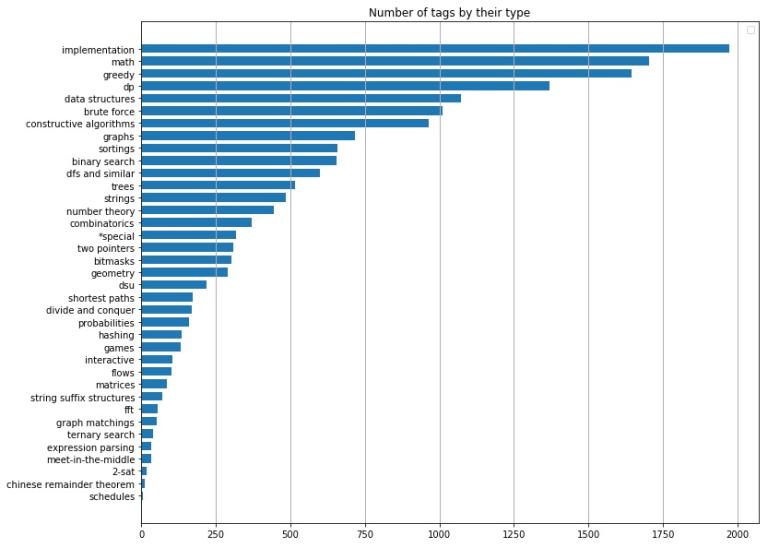
186 problems have no tags, but every problem may have more than 1 tag label, so there are 17006 tag labels in all problems. Tag distribution for all problems is here
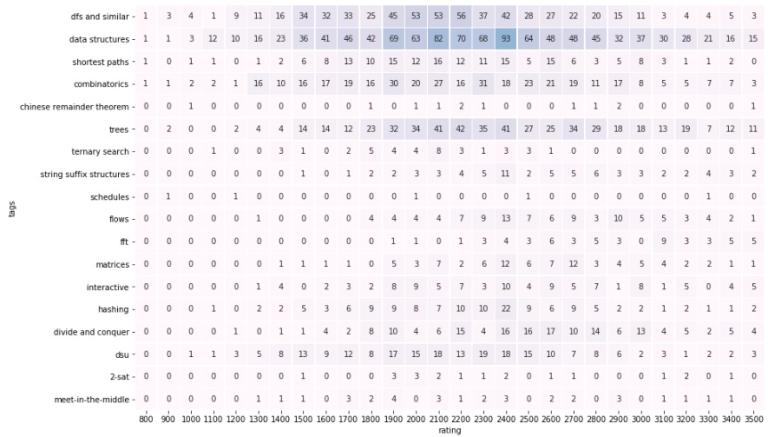
Let's create a heatmap shown combination of tags and problem complexity. I split it up into two parts because of its size. 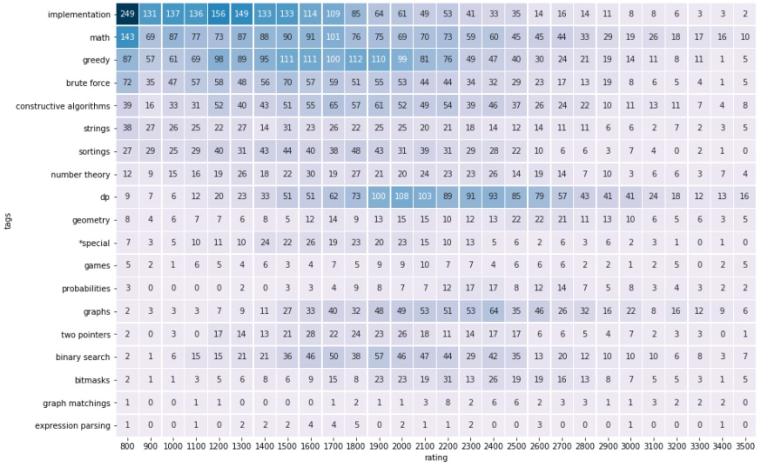
UPD. Not quite sure how to add a picture to comment:) Lakshi4h asked about percentage of math problems in a contests


Thank you so much :D
well looks like I was wrong haha
This is really cool!
For the heat-maps, some rows, like the first five, dp, and data structures, have many more problems than others, so maybe you could represent it as a percentage of the maximum number of occurrences.
This might run into a problem with some much less common topics like schedules and crt, so maybe you could exclude the ones with the maximum number of occurrences less than 5 or 10?
I'm using "maximum number of occurrences" to mean the highest number of problems with a certain topic having some rating, like the "maximum number fo occurrences" for hashing would be 22 because 22 hashing problems are rated 2400, and that's the maximum.