Heidi is a statistician to the core, and she likes to study the evolution of marmot populations in each of V (1 ≤ V ≤ 100) villages! So it comes that every spring, when Heidi sees the first snowdrops sprout in the meadows around her barn, she impatiently dons her snowshoes and sets out to the Alps, to welcome her friends the marmots to a new season of thrilling adventures.
Arriving in a village, Heidi asks each and every marmot she comes across for the number of inhabitants of that village. This year, the marmots decide to play an April Fools' joke on Heidi. Instead of consistently providing the exact number of inhabitants P (10 ≤ P ≤ 1000) of the village, they respond with a random non-negative integer k, drawn from one of two types of probability distributions:
- Poisson (d'avril) distribution: the probability of getting an answer k is
 for k = 0, 1, 2, 3, ...,
 - Uniform distribution: the probability of getting an answer k is
 for k = 0, 1, 2, ..., 2P.
Heidi collects exactly 250 answers per village. Every village follows either the Poisson or the uniform distribution. Heidi cannot tell marmots apart, so she may query some marmots several times, and each time the marmot will answer with a new number drawn from the village's distribution.
Can you help Heidi to find out whether a village follows a Poisson or a uniform distribution?
The first line of input will contain the number of villages V (1 ≤ V ≤ 100). The following V lines each describe one village. The description of each village consists of 250 space-separated integers k, drawn from one of the above distributions.
Output one line per village, in the same order as provided in the input. The village's line shall state poisson if the village's distribution is of the Poisson type, and uniform if the answer came from a uniform distribution.
2
92 100 99 109 93 105 103 106 101 99 ... (input is truncated)
28 180 147 53 84 80 180 85 8 16 ... (input is truncated)
poisson
uniform
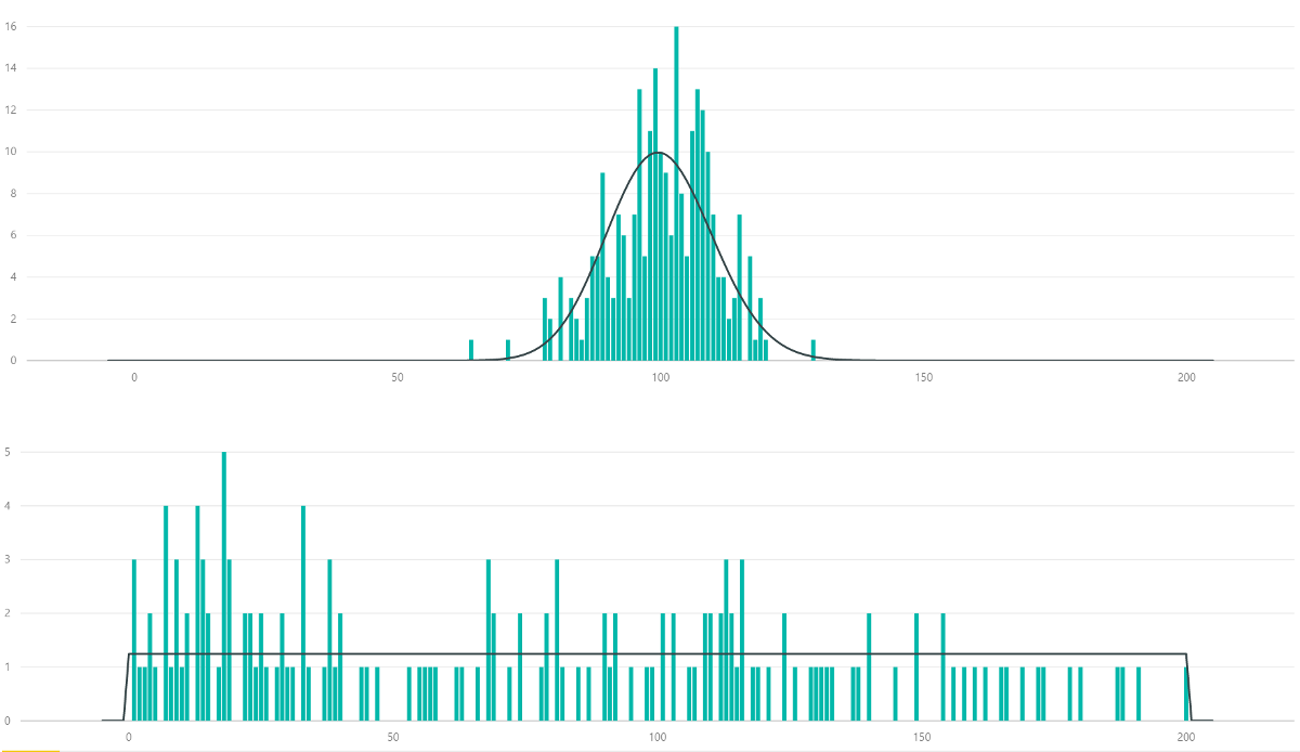
The full example input is visually represented below, along with the probability distribution function it was drawn from (the y-axis is labeled by its values multiplied by 250).