


Hello everyone! I have created a tool to create graphs and visualise graph algorithms — Graph Visualiser. It can be used to visualise graph algorithms in a step-by-step fashion. By adding just a few lines in your code of an algorithm, you can create a list of animation events which can then be viewed by the app.
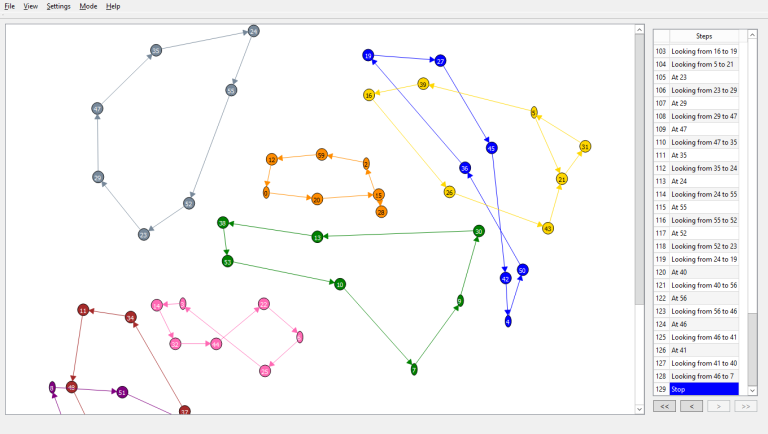 Here I have used the app to demonstrate Tarjan's algorithm to find Strongly Connected Components.
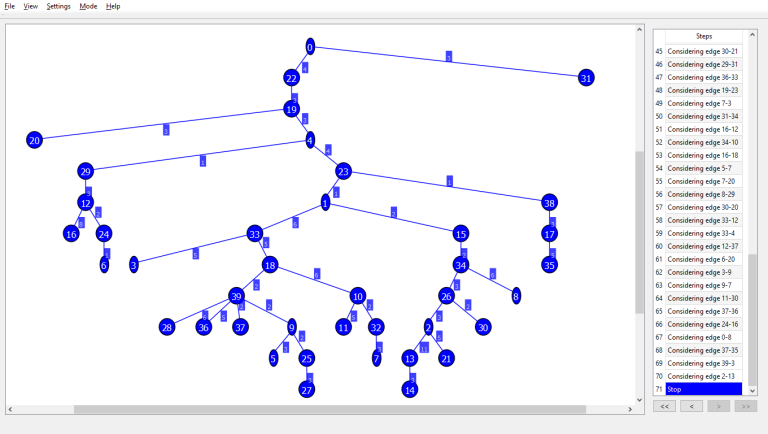 Here I have used the app to demonstrate Kruskal's algorithm to find Minimum Spanning Tree. The animations are created using the GraphAnimator library (available for C++ and Java).
You can also create graphs in the app as shown below. 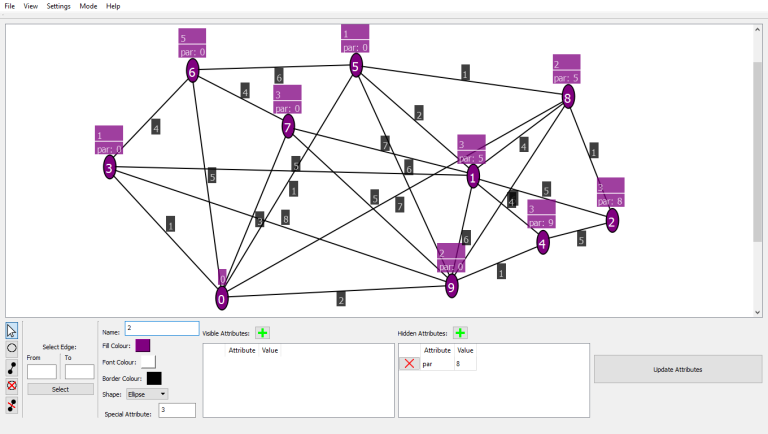
Download Graph Visualiser:- Windows Linux
The zip file contains a pdf which has instructions on how to setup the app as well as information on all the features provided by the app. The zip file also contains sample codes.
Happy Coding and Happy New Year in advance!


