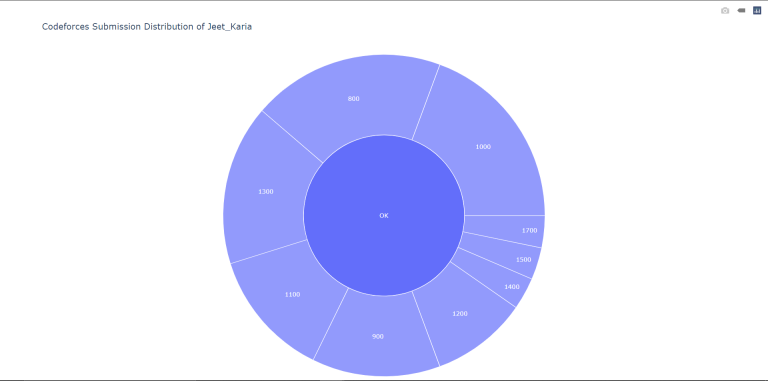
This helps in, more detailed analysis of your submissions to the codeforces which contains tags, verdicts, and ratings, all three combined in one interactive pie-chart made using plotly(OpenSource Graphing Library for python).
You can access the script here. If your handle is Jeet_Karia then run the script as: python cf-sub-dist3.py --handle Jeet_Karia
Output will be as below: 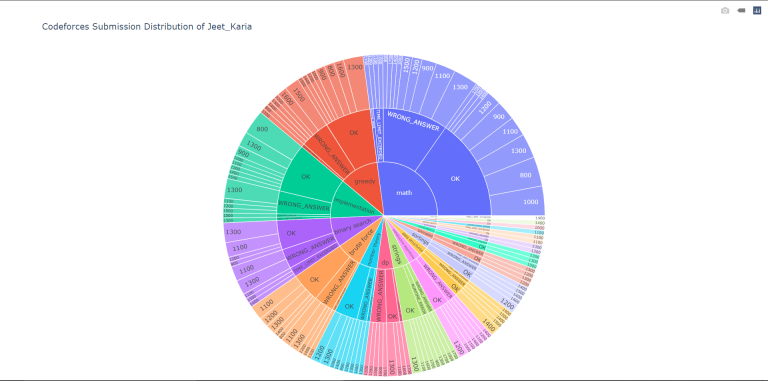
If clicked on one of the tags (say math), then pie chart turns to: 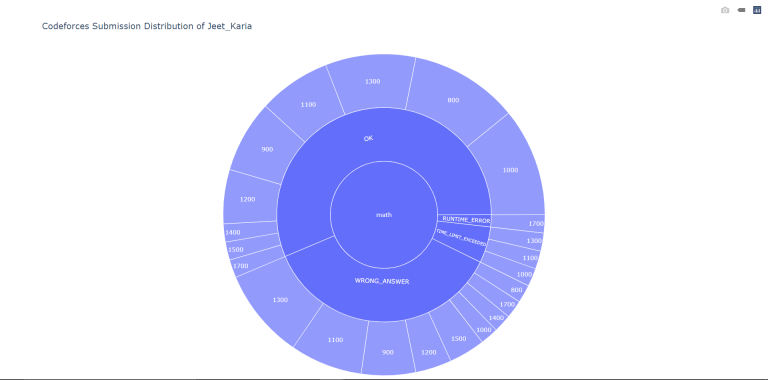
If clicked on one of the verdicts(say OK) the pie-chart turns to: