


I have created certain CodeForces submission visualization some days back (can be found in my previous blog entries). And getting a really positive response, I thought of combining all of them at one place and make them easy to use which obviously needs deploying to web and needs nothing more than a good internet. So, I have come up with this small Dash python app which allows us to create really nice data analytics app and the main thing is its OpenSource.
Just follow the instructions written in the top left corner of the page when it's launched from the web.
They will look something like this:
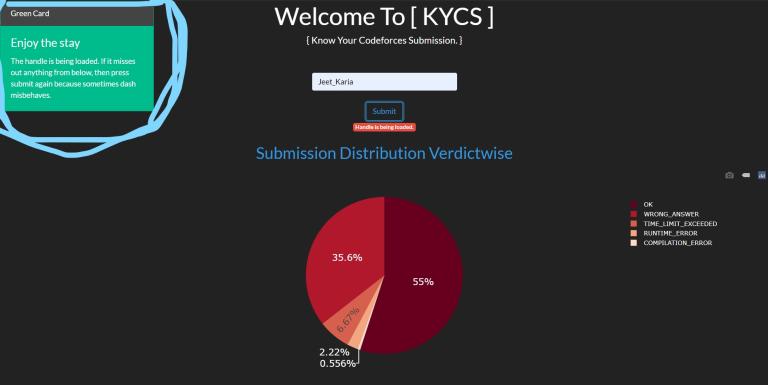
It's as easy to follow as it sounds. (Link to the app)
Also if someone would like to contribute, then source code is here.


Your profile gives, my AC score of 62%, while stopstalk shows it for me as 49%. Just curious, are you sure about its correctness, because I feel in my case that it should be around the percentage indicated by stopstalk.
Yes, it is correct. I think the difference might be in counting the UNRATED problems. I am even counting the GYM problems which are unrated and that seems to increase the count. I think that's the only problem.