A progress bar is an element of graphical interface that displays the progress of a process for this very moment before it is completed. Let's take a look at the following form of such a bar.
A bar is represented as n squares, located in line. To add clarity, let's number them with positive integers from 1 to n from the left to the right. Each square has saturation (ai for the i-th square), which is measured by an integer from 0 to k. When the bar for some i (1 ≤ i ≤ n) is displayed, squares 1, 2, ... , i - 1 has the saturation k, squares i + 1, i + 2, ... , n has the saturation 0, and the saturation of the square i can have any value from 0 to k.
So some first squares of the progress bar always have the saturation k. Some last squares always have the saturation 0. And there is no more than one square that has the saturation different from 0 and k.
The degree of the process's completion is measured in percents. Let the process be t% completed. Then the following inequation is fulfilled:

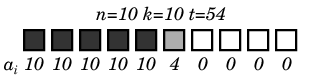
An example of such a bar can be seen on the picture.
For the given n, k, t determine the measures of saturation for all the squares ai of the progress bar.
We are given 3 space-separated integers n, k, t (1 ≤ n, k ≤ 100, 0 ≤ t ≤ 100).
Print n numbers. The i-th of them should be equal to ai.
10 10 54
10 10 10 10 10 4 0 0 0 0
11 13 37
13 13 13 13 0 0 0 0 0 0 0
| Codeforces Beta Round 65 (Div. 2) |
|---|
| Finished |


