


449. Dendrograms
Time limit per test: 0.5 second(s)
Memory limit: 262144 kilobytes
Memory limit: 262144 kilobytes
input: standard
output: standard
output: standard
Nod Ishimatsu is a student majoring computer science. He has wrote a program that performs hierarchical clustering, for the end-term project in a class of Introduction to Artificial Intellegence. Clustering is the process of grouping a set of objects into subsets called clusters, so that each cluster contains those similar in some sense. Hierarchical clustering is a way to do this indirectly; it produces trees (or in this problem collections of trees) called dendrograms. A dendrogram represents similarity among objects. The figure below shows an example dendrogram.
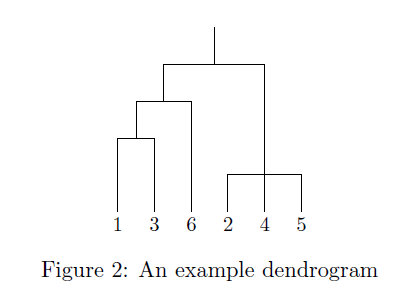
Leaves (at the bottom) denote objects. The horizontal lines split the objects into two or more subgroups and indicate objects in different subgroups are less similar than those in the same subgroup. Thus, basically, the upper the line is located, the less similar the objects or the sets of objects connected by it. We can have, for example, three clusters by using the top two horizontal lines. Nod's program also outputs dendrograms, but it has two problems. Firstly, output dendrograms are sometimes not fully connected, i.e. output can contain multiple trees. We don't deal with this problem here. Secondly, the produced dendrograms are fairly messy. Here is an example:
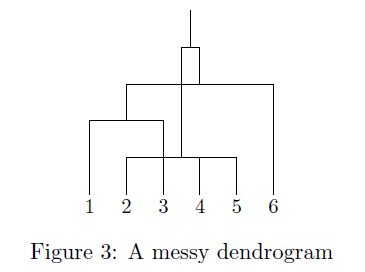
Maybe we want to change the order of the objects and have a clean diagram like the one shown above. Your task is to write a program for this purpose, i.e. reordering the objects for a clean diagram. Here, by clean diagrams, we mean those with no crosses of vertical and horizontal lines. There is usually more than one clean diagram; among them your program should pick the one in which the object of the smaller number comes to the left (in a lexicographical manner). Refer to the sections of Input and Output for the detailed specification.
Input
The input is given in the following format: N M Q splitInfo1 splitInfo2 ... splitInfoM query1 query2 ... queryQThe first line contains three integers N (1 ≤ N ≤ 100000), M (0 ≤ M < N), and Q (1 ≤ Q ≤ 1000, Q ≤ N), which represents the numbers of objects, horizontal lines, and queries respectively. Then M lines follow to describe horizontal lines. Each line is given in the following format: Y L V1 V2... VL Y (0 ≤ Y ≤ 109) denotes the vertical position of the horizontal line; the smaller value indicates the upper position (or the less similarity). L is the number of vertical lines (i.e. objects or subgroups of objects) connected by the line. Vi (for 1 ≤ i ≤ L) indicates each of the vertical lines. Each object is indicated by its identifier, a unique number from 1 to N. Each subgroup of objects is indicated by the identifier of an arbitrary object in the subgroup. Following the description of horizontal lines, there are Q lines each of which indicates a leaf index at which your program should report which object should be placed. The index is given by a number from 1 (leftmost) to N (rightmost).
Output
Print Q lines where the i-th line indicates the identifier of the object at the i-th queried position. Example(s)
sample input | sample output |
3 2 3 10 2 1 2 20 2 3 2 1 2 3 | 1 2 3 |
sample input | sample output |
5 2 5 10 3 1 2 4 20 3 2 3 5 1 2 3 4 5 | 1 2 3 5 4 |
sample input | sample output |
4 1 4 10 2 1 4 1 2 3 4 | 1 4 2 3 |
sample input | sample output |
4 3 4 30 2 1 4 20 2 2 4 10 2 3 4 1 2 3 4 | 1 4 2 3 |
sample input | sample output |
4 3 4 10 2 1 4 20 2 2 4 30 2 3 4 1 2 3 4 | 1 2 3 4 |
sample input | sample output |
4 3 4 10 2 1 2 15 2 1 4 20 2 2 3 1 2 3 4 | 1 4 2 3 |
sample input | sample output |
3 2 3 10 2 2 3 20 2 1 2 1 2 3 | 1 2 3 |
sample input | sample output |
1 0 1 1 | 1 |
Codeforces (c) Copyright 2010-2024 Mike Mirzayanov
The only programming contests Web 2.0 platform
Server time: Apr/18/2024 15:04:36 (h1).
Desktop version, switch to mobile version.
Supported by
