


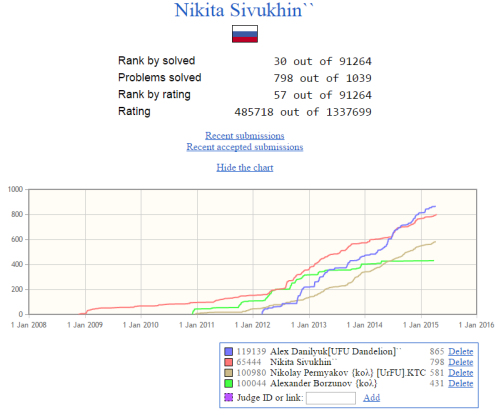
Timus Charts is an extension for a browser that adds a chart of count of solved problems to Timus Online Judge's profiles. With it, you can observe users' activity and, if they solve problems regularly, compare their experience at various times. In addition, the extension slightly changes colors in the problems map to improve it's usability.
The new version adds several new features, fixes some bugs, and supports most of popular browsers:
You can add more users to the chart.
Loading of the chart has sped up due to using API and caching data. If your visited the current profile before, only a few count of last submits will be queried. If count of solved problems isn't changed after previous visit, no queries will be executed at all.
You can hide the chart (it won't appear right after page loading anymore) or show it again by clicking on a link. Now the chart appearance doesn't interfere with the page scrolling.
Now extension properly processes accounts with small count of solved problems and problems from competitions that were added to the main archive. There're a number of cosmetic changes from the previous version.
The extension uses jQuery and jqPlot libraries.
Installation
 Google Chrome
- The extension is available in Chrome Web Store.
 Firefox
Install Greasemonkey.
The extension will be available for installation on the page on OpenUserJS.org.
 Opera > 12 and
  Yandex.Browser
- The extension is available on Opera Add-ons.
 Safari
Install Tampermonkey for Safari.
The extension will be available for installation on the page on OpenUserJS.org.
UPD. You can find extension source code on GitHub.
See also
- Timus Friends extension by slava.sh


I had it installed, but sometimes the time scale (x axis) is wrong and had no proportion. If you are the developer or you know him, tell him this issue. Anyway is a great tool and I still use it in muy actual PC. Thanks For sharing here!