


Hi everyone, I made a website using the Codeforces API that can graph your Rating vs Count of Problems Solved. I can also filter to see how you're improving if you only count problems of a specific rating or higher.
The URL is https://codeforcesplot-app-5def7a85c434.herokuapp.com.
This is the application UI: 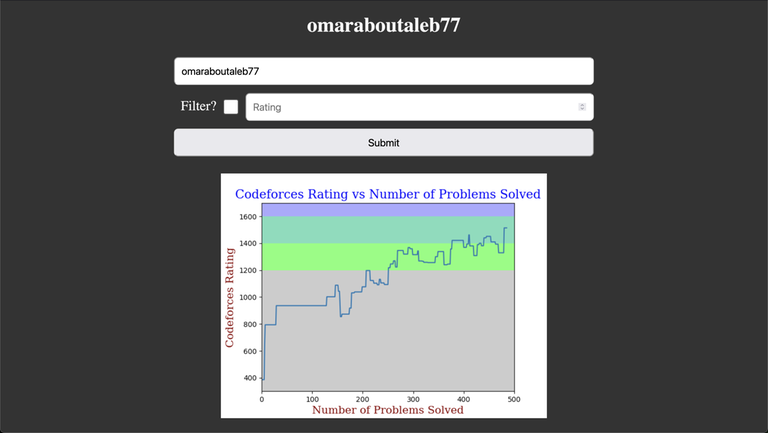
By default, the website displays all problems, but you can filter the problems to only display problems above a specific rating.
You also no longer need a CLIST account to be able to plot your data. All codeforces accounts work.

