


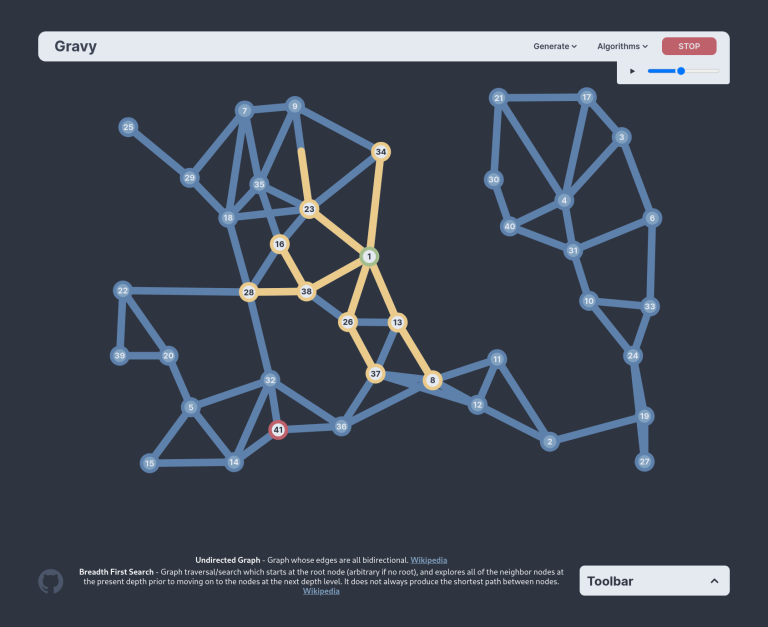
In my first blog post on CF, I would like to present Gravy, a graph visualisation tool/toy which allows you to generate/edit graphs and visualise common algorithms on them. The project is written with Svelte and Typescript using SVG. It's mostly intended for beginners like me but it should be interesting either way.
I created the project as I couldn't find a simple, easy-to-use graph visualisation toy on the web.
The project is now LIVE at gravy.thud.dev.
The code is available at github.com/thud/gravy.
Any bugs/feature-requests can be created on the Github repo's issues. Suggestions are welcome.
I hope you enjoy it!
Thanks,
JP


Auto comment: topic has been updated by thud (previous revision, new revision, compare).
Looks nice!
Currently, the visualization of Dijkstra seems to pick the best edge from the BFS tree, not from all possible edges.
Quite right, working on it now!
I believe it's now fixed (along with some small bugs). Thanks for your input, much appreciated.
Yeah, Dijkstra works better now.
The UI is so cool.
Is it possible to generate a graph from text input, like the typical graph representation in competitions (newline-separated pairs of connected indices)?
CS Academy's graph tool supports that and it's been invaluable for visualising graphs from sample test cases.
Hey Norrius, That's a great suggestion. I'll work on adding that as soon as possible. Thanks for the input!
Also, being able to export to that format would be nice.
Yeah that should be feasible. Thanks for the suggestion.
This is now possible with the new update!
I've been working on the text editor feature this week and it is now live! (available in the toolbar settings)
However, be aware that I expect some bugs to be present since the code was definitely non-trivial.
I'll try to keep working on it over the next week and iron out some of the bugs and weirdness but I can't promise that I'll have the time.
I originally wanted to have a mode where connection data would auto-update as you create connections with the GUI but that was proving challenging and a bit glitchy, so I've since abandoned that. Instead, you can now grab the current graph's representation with a button. I might yet return to that idea depending on what you guys think but I hope this is satisfactory.
Thanks for the input, this will hopefully make gravy significantly more useful for people so I'm very grateful for it. (Sorry for the delay, school's just starting up again)
Very cool! I can see this helping with debugging a lot (AKA coming up with random graphs to test)
Yeah thanks!
This is amazing!! Bookmarked this one. Thank you!