


Introduction
As mentioned in my previous blog, I will be writing a tutorial about slope trick. Since there are already many blogs that goes through the concept of slope trick, my blog will focus more on the intuition behind coming up with the slope trick algorithm.
Hence, if you do not know slope trick yet, I suggest that you read other slope trick blogs such as https://codeforces.com/blog/entry/47821 and https://codeforces.com/blog/entry/77298 before reading my blog. In the future explanation on the example problems, I will assume that the reader already knows the big idea behind slope trick but do not know how to motivate the solution.
When to use slope trick?
Most of the time, slope trick can be used to optimise dp functions in the form of $$$dp_{i, j} = \min(dp_{i - 1, j - 1}, dp_{i - 1, j} + A_i)$$$ or something similar. In this kind of dp functions, the graph of the dp function where the x-axis is $$$j$$$ and y-axis is $$$dp_{i, j}$$$ changes predictably from $$$i$$$ to $$$i + 1$$$ which allows us to store the slope-changing points and move to $$$i + 1$$$ by inserting and deleting some slope-changing points.
Sometimes, slope trick can also be an alternative solution to a greedy solution. The code will probably end up being the same as well, so sometimes slope trick can help you to find out the greedy solution instead. Personally, I find that slope trick is very helpful in this area as we do not have to proof the greedy since dp completely searches all possible states and is definitely correct.
Examples
Social Distancing
Abridged Statement
You are given a array of $$$n$$$ numbers $$$a_1,a_2,\ldots,a_n$$$. You want to select a permutation $$$p_1,p_2,\ldots,p_n$$$ of size $$$n$$$ such that the following cost $$$\sum\limits_{i=1}^{n-1} a_{\max(p_i, p_{i+1})}$$$ is minimized. Find the minimum possible cost.
Ideas
We can iterate from $$$i=1$$$ to $$$i=n$$$ and pick which position to put $$$i$$$. If you put $$$a_i$$$ directly adjacent to two earlier elements, it will contribute to a cost of $$$2a_i$$$. If you put it adjacent to one, it will contribute to a cost of $$$a_i$$$. Otherwise, if you put it by itself, it will not contribute to the cost.
For example, for the array $$$a = [1, 3, 5]$$$, we first place $$$a_1$$$ by itself as there is nothing else placed yet. Then, we can put $$$a_2$$$ by itself as well and finally we put $$$a_3$$$ in the middle of both of them, contributing to a cost of $$$10$$$. However, we can achieve a cost of 8 by putting $$$a_2$$$ next to $$$a_1$$$, contributing to a cost of $$$3$$$ and finally putting $$$a_3$$$ next to $$$a_2$$$, contributing to a cost of $$$5$$$.
We can think of the operations as the following. Combining two connected components incur a cost of $$$2a_i$$$, doing nothing incurs a cost of $$$a_i$$$, and adding a connected component is free. Hence, we can come up with the following dp.
$$$dp[i][j] = \min(dp[i - 1][j + 1] + 2a_i, dp[i - 1][j] + a_i, dp[i - 1][j - 1])$$$
Using the same array $$$a = [1, 3, 5]$$$, we have the following dp table where the cell in the $$$i$$$-th row and $$$j$$$-th column represent $$$dp[i][j]$$$.
| i\j | 1 | 2 | 3 |
|---|---|---|---|
| 1 | 0 | $$$\infty$$$ | $$$\infty$$$ |
| 2 | 3 | 0 | $$$\infty$$$ |
| 3 | 8 | 3 | 0 |
Solution
From the dp function, we can see that $$$dp[i]$$$ is just made up of 3 different copies of $$$dp[i - 1]$$$ shifted in different directions. This is often how slope trick looks like. Let us draw some graphs to see how the dp changes from $$$i - 1$$$ to $$$i$$$.


Let us see how we can obtain the graph of $$$dp[i]$$$ from $$$dp[i - 1]$$$. From the recurrence relation, we can see that $$$dp[i]$$$ is obtained by taking the minimum of the following 3 graphs: $$$dp[i - 1]$$$ shifted 1 to the right, $$$dp[i - 1]$$$ shifted $$$a_i$$$ upwards, and $$$dp[i - 1]$$$ shifted 1 to the left and $$$2a_i$$$ upwards.
As you can see in the image to the right, $$$dp[3]$$$ (shown in blue lines) can be formed by duplicating $$$dp[2]$$$ (shown in dotted lines) 3 times. Furthermore, the gradients of the resulting graph seems to be related to $$$a_i$$$.
Let us see how the dp function changes for a more complicated function. For this purpose, we will use the array $$$a = [1, 5, 5, 3, 6, 4]$$$. Supposed we have already calculated $$$dp[5]$$$ (shown in dotted lines) and want to calculate $$$dp[6]$$$.
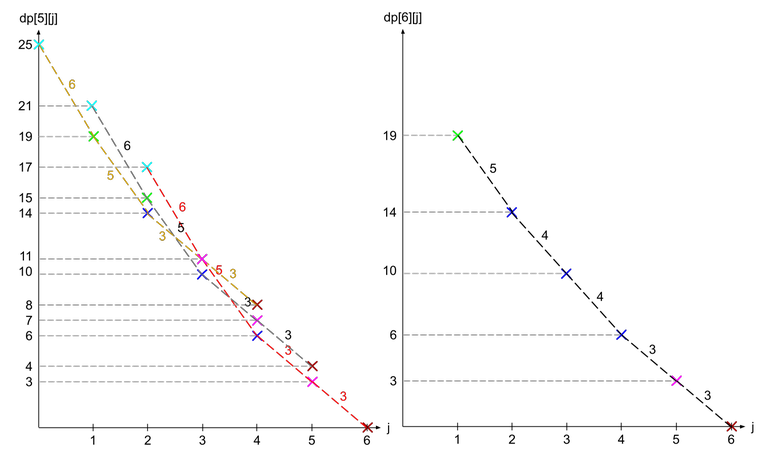
Note that the crosses are colour coded according to which $$$j$$$ it came from ($$$dp[5][1]$$$ is cyan, $$$dp[5][2]$$$ is green, $$$dp[5][3]$$$ is blue, $$$dp[5][4]$$$ is magenta, and $$$dp[5][5]$$$ is brown). We can see that as we compare the 3 overlapping graphs, the point where one graph starts to become the minimum is when the gradient becomes larger than $$$a_i$$$ (in this case $$$a_6 = 4$$$). Why is that so?
If we only compare the red and black line, we see that the difference between a point on the red line and the same coloured point on the black line (it is one spot to the left) always has a difference of $$$a_i$$$. This is because same coloured points comes from the same $$$dp[i - 1][j]$$$ and only differ from shifting upwards by $$$a_i$$$.
Hence, when we look from right to left, while the gradient of the red line is less than $$$a_i$$$, the red line is always optimal as the difference between two adjacent points on the red line is equal to the gradient while the difference between the adjacent points on the black line and red line is equal to $$$a_i$$$. The moment $$$a_i$$$ becomes smaller than the gradient, the black line becomes more optimal instead, and when we switch from the black line to red line, the new gradient in between the two lines is $$$a_i$$$ (see the blue points on the right graph).
Hence, if we store the gradients of $$$dp[i - 1]$$$ in a priority queue, all we need to do to transition to $$$dp[i]$$$ is to insert $$$a_i$$$ two times. However, since we do not want $$$dp[i][0]$$$, we can just pop out the largest gradient which represents $$$dp[i][0]$$$. Then after we are done processing $$$dp[n]$$$, the answer is just the sum of the gradients in the priority queue.
ARC123D — Inc, Dec — Decomposition
Abridged Statement
Given an array of $$$n$$$ numbers $$$a_1, a_2, \ldots, a_n$$$.
You want to construct two arrays $$$b_1, b_2, \ldots, b_n$$$ and $$$c_1, c_2, \ldots, c_n$$$ that satisfies the following conditions
- $$$a_i = b_i + c_i$$$ for all $$$1 \le i \le n$$$,
- $$$b$$$ is non-decreasing,
- $$$c$$$ is non-increasing
Find the minimum possible cost of $$$\sum_{i=1}^n(|b_i| + |c_i|)$$$
Ideas
We define $$$dp[i][j]$$$ as the minimum possible cost from $$$1$$$ to $$$i$$$ such that $$$b_i \le j$$$. By letting $$$b_i = k$$$ for each $$$k \le j$$$, we can come up with the following relation
$$$dp[i][j] = \max_{k \le j} (dp[i - 1][k - \max(0, a_i - a_{i - 1})] + |k| + |a_i - k|)$$$
The reason why we have $$$dp[i - 1][k - \max(0, a_i - a_{i - 1})]$$$ is to account for the non-increasing property of $$$c$$$. Let $$$k' = b_{i - 1}$$$ and $$$k = b_i$$$. Then, $$$c_{i - 1} = a_{i - 1} - k'$$$ and $$$c_i = a_i - k$$$. Since $$$c_{i -1} \ge c_i$$$, we have $$$a_{i - 1} - k' \ge a_i - k$$$, it simplifies to $$$k' \le k - (a_i - a_{i - 1})$$$.
Solution
Does the absolute signs remind you of 713C - Sonya and Problem Wihtout a Legend? If we plot the graph of $$$y = |x| + |a_i - x|$$$, we get

We observe that from $$$0$$$ to $$$a_i$$$, the line is horizontal at y coordinate of $$$a_i$$$ and on the left and right side of the horizontal line, the gradient is $$$-2$$$ and $$$2$$$ respectively. We can handle this easily by just inserting the slope-changing points into a priority queue.
Next, we have to handle $$$dp[i - 1][j - \max(0, a_i - a_{i - 1})]$$$. This means that we just have to offset the graph of $$$dp[i - 1]$$$ by $$$\max(0, a_i - a_{i - 1})$$$ units to the right. To do this, we just store an extra variable offsetwhich represents how much the original graph was shifted by.
Now, in order to combine both the shifted $$$dp[i - 1]$$$ and the $$$|j| + |a_i - j|$$$, we store all the slope changing points in a priority queue, offset the points, and then insert extra slope changing points at $$$0$$$ and $$$a_i$$$.
To illustrate this, we will use the array $$$a=[1, -2, 3]$$$. To move from $$$dp[2]$$$ to $$$dp[3]$$$, we first shift the graph of $$$dp[2]$$$ by $$$5$$$ units to the right. Then, we add on $$$y = |x| + |5 - x|$$$, which is shown below as the blue line.

For ease of implementation, observe that the slopes changes by 2 every time, so we can just let each point in the priority queue represent a change in 2 units of gradient.


