I'm excited to share a tool I've created to help visualize and solve interval-related problems. Check it out here: https://intervals-visualiser.vercel.app/
What is the Intervals Visualizer?
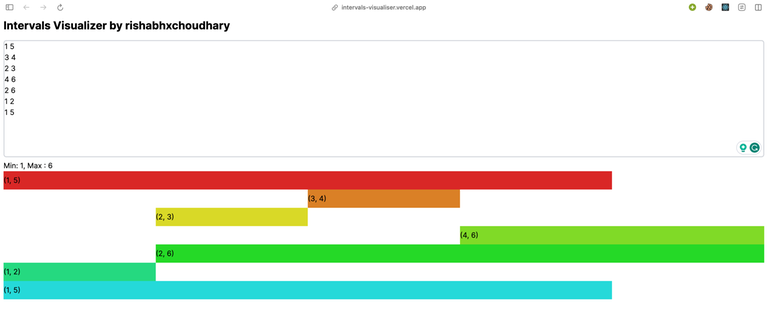
The Intervals Visualizer is a web application that allows you to input intervals and see them visually on the screen. It's a handy tool for tackling problems involving intervals, whether you're working on mathematical exercises, programming challenges, or any other scenario where visualizing intervals is beneficial.
How to Use the Intervals Visualizer
Visit the Intervals Visualizer website. Enter your intervals in the provided text area. Each interval should be on a new line, with start and end values separated by a space. Watch as the intervals are dynamically displayed on the screen, giving you a clear visual representation of their positions and lengths.
Why Use the Intervals Visualizer?
Visualization: Easily understand the distribution and relationship between intervals. Quick Feedback: Instantly see the impact of changes to your interval inputs. Educational: Ideal for learning about intervals and solving related problems. Whether you're a student studying math, a programmer tackling coding challenges, or anyone dealing with interval-related problems, the Intervals Visualizer can be a valuable asset.
Give it a try and let me know what you think! Intervals Visualizer
Happy interval visualizing!
preview: